Some screenshots of MINC and the vt105 – literally screenshots, with a camera in front of an LCD screen. And an old one at that, the spots you might notice are caused by worn backlight tubes, and the top end is a bit darker because of the viewing angle. The current version of the vt105 has VGA output only; some future version will probably have digital I/O and allow for more modern and crystal clear screenshots – or maybe I’ll come up with a trick to save screenshots directly. It was kind of fun to do this way though, painstakingly aligning the screen to the camera on a tripod, and trying to type commands without hitting either. Kudos for the first one to correctly name all edits I had to do to the photos for them to come out like this 😉
The screenshots are from the examples in MINC-11 Book 4: MINC Graphic Programming – I used that book a lot to check if I was on the right track with my vt105 implementation.
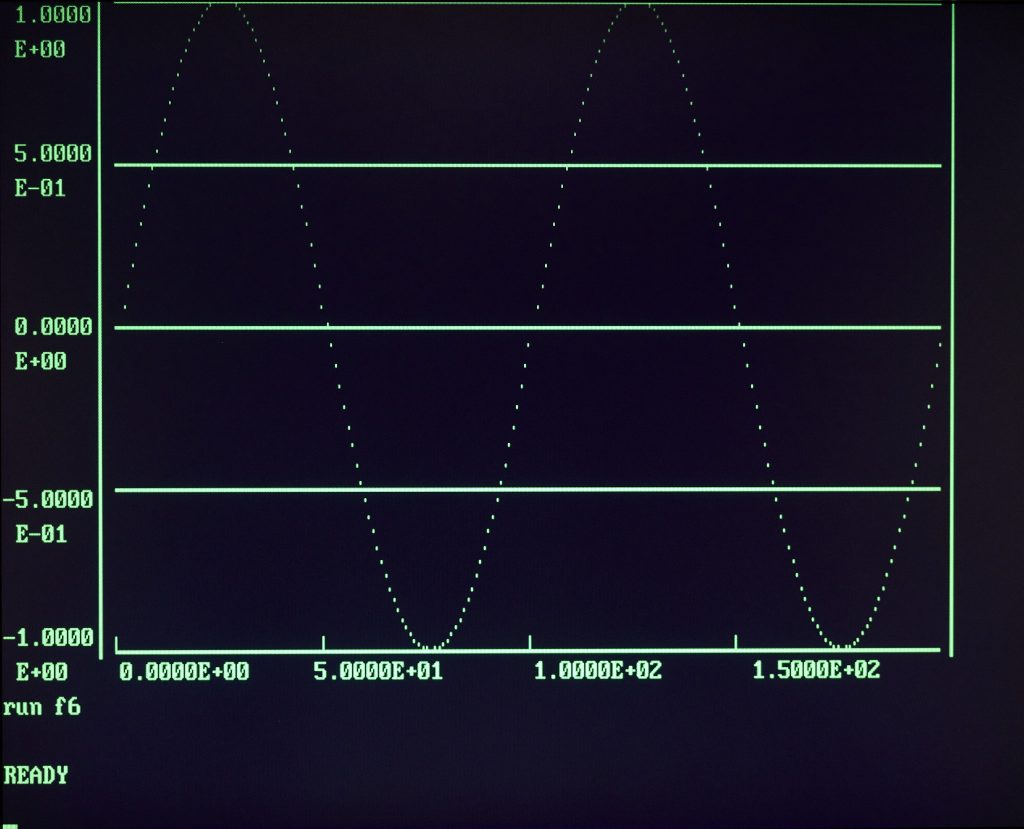
MINC can of course sample analog data, but the book uses datasets directly created from mathematical functions – so you can easily recreate the same graphs. The book works really well to show all the different options and parameters for the GRAPH statement – and there are many. Figure 6 starts with a simple sine, created from the following program:
10 DIM X1(199),F1(10),Y1(199)
20 FOR I=0 TO 199
30 Y1(I)=SIN(I*PI/50)
40 X1(I)=LOG10(I+1)
50 NEXT I
And then one simple statement to create a graph from that:
GRAPH(,,,Y1(0))
That’s all – pretty powerful, and very useful for the laboratory setting that MINC was created for. And there’s more: MINC can do two graphs at the same time by dividing the screen in an upper and lower half.
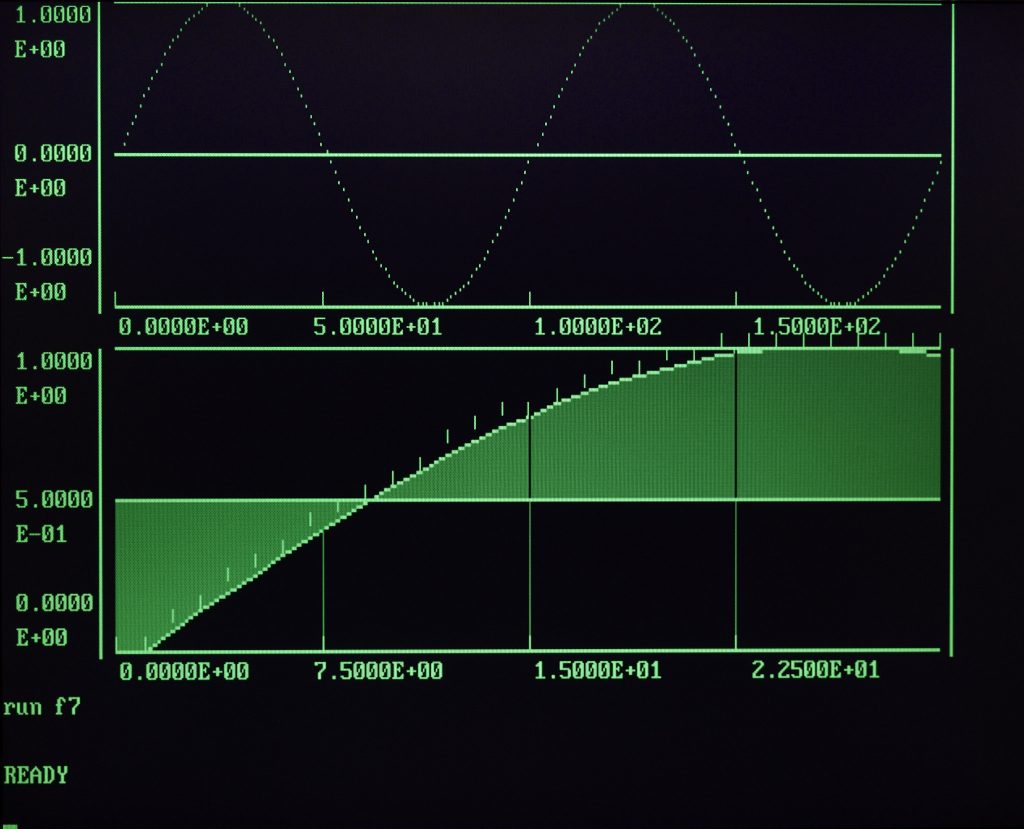
The lower graph – showing a small part of the sine wave – uses some of the other tricks: shading and markers (or ‘brands’, in the MINC BASIC translation). Useful to show the source values in the graph, in contrast to interpolations. And quite flexible, enabling or disabling a keyword on the GRAPH statement making a graph look completely different. As in the example, figure 9:
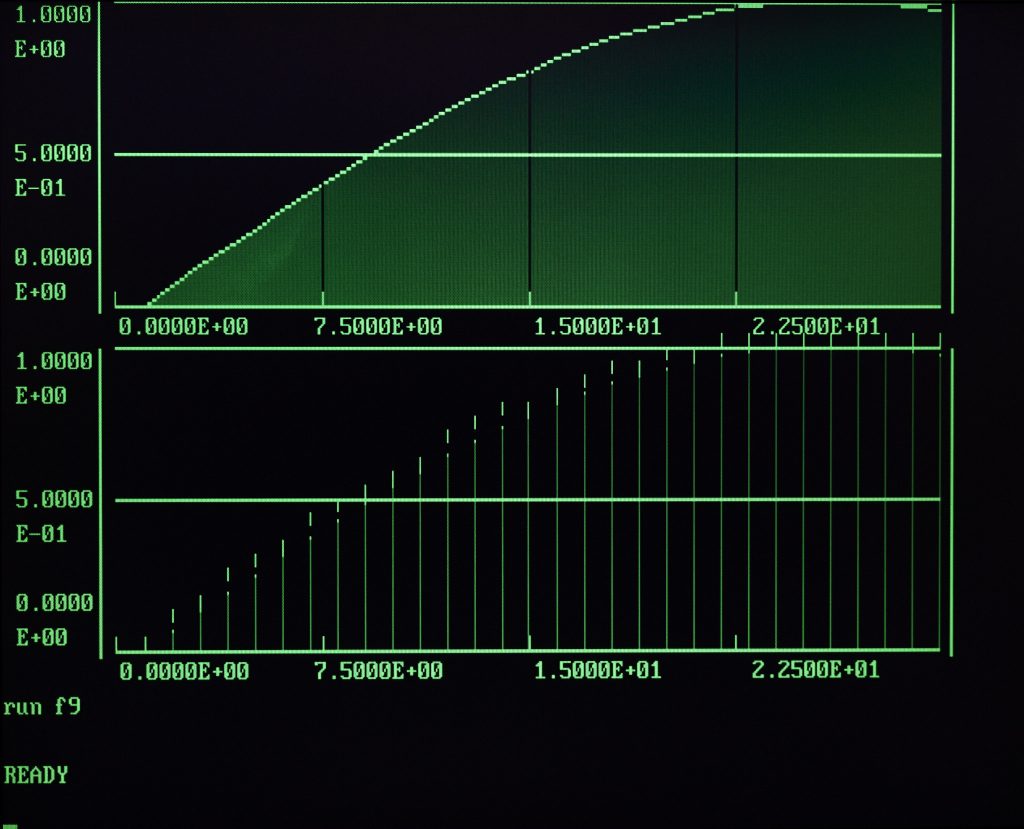
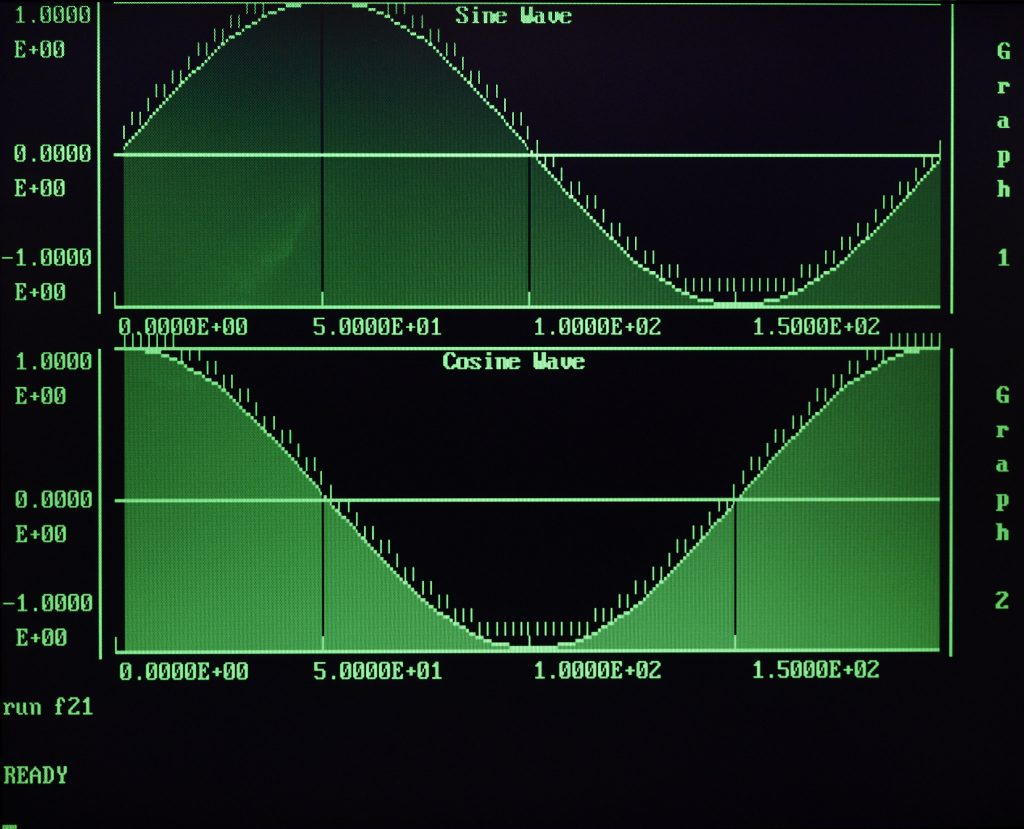
Or something like this – with some different data:
10 DIM Y(200)
20 FOR I=1 TO 200 STEP 2
30 Y(I-1)=SIN(I*PI/100)
40 Y(I)=COS(I*PI/100)
50 NEXT I
60 REGION('UPPER',1)
70 REGION('LOWER',2)
80 GRAPH('SHADE,LINES,BRANDS',100,,Y(0),2,,1)
90 GRAPH('SHADE,LINES,BRANDS',100,,Y(1),2,,2)
100 LABEL('BOLD','Sine Wave','Graph 1',1)
110 LABEL('BOLD','Cosine Wave','Graph 2',2)
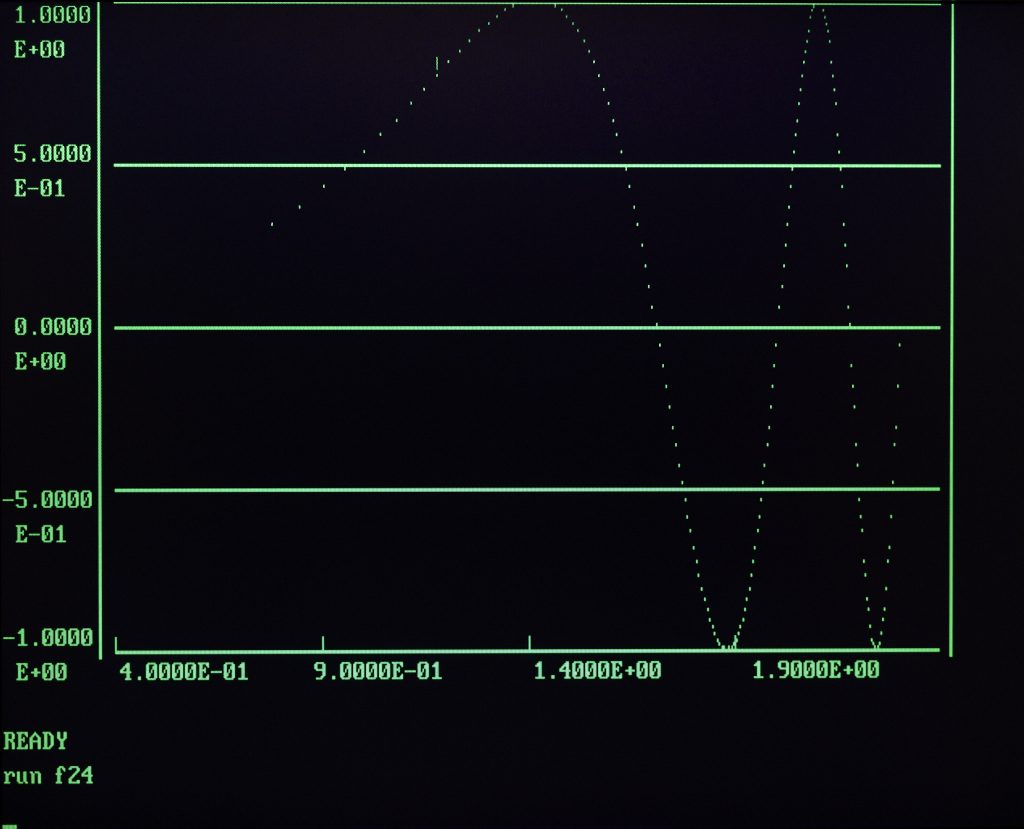
The next trick doesn’t really display very well – it needs a movie or a live demonstration really. You can set up a graph such that the user can scroll over the data points, highlighting one of the markers – and then set an action on those. Note the highlighted marker on Figure 24.
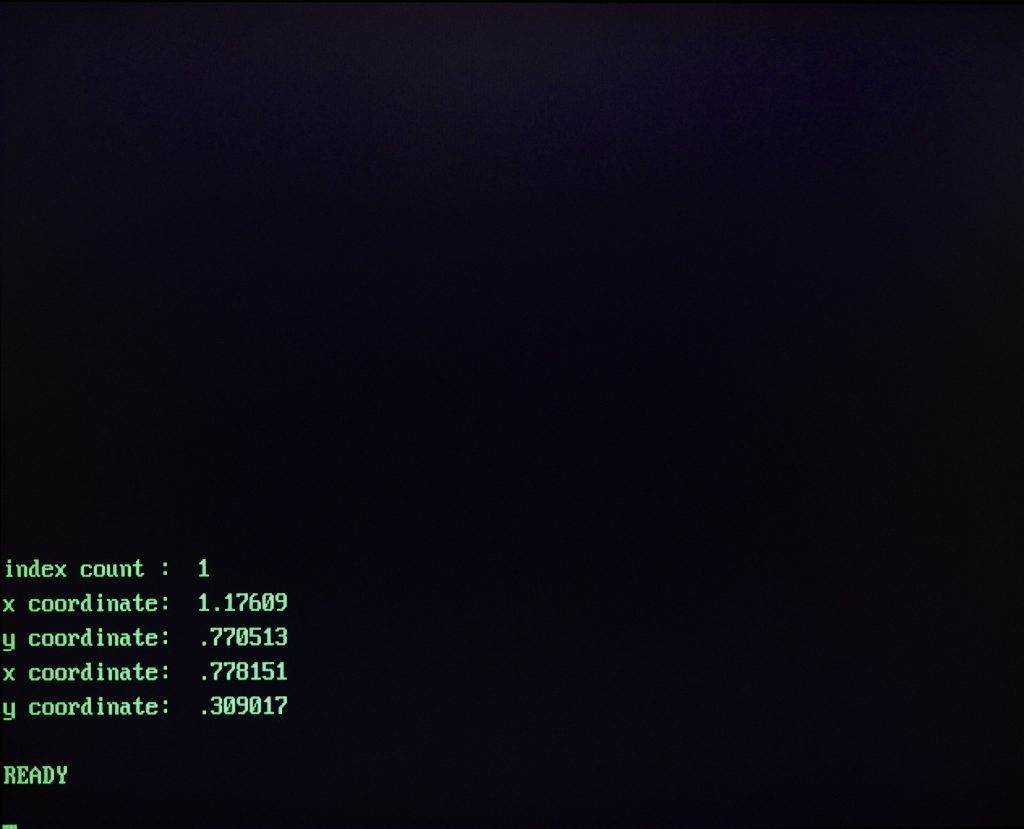
and the output from selecting that point – in a very simple example that just displays the X and Y values.
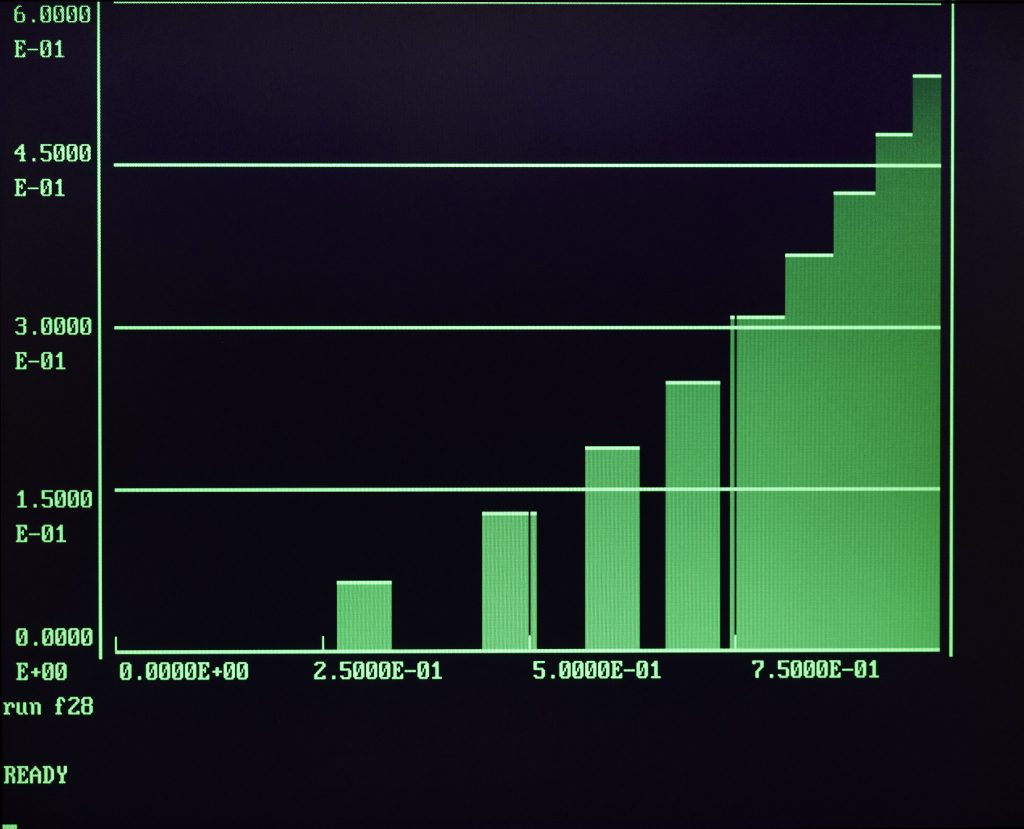
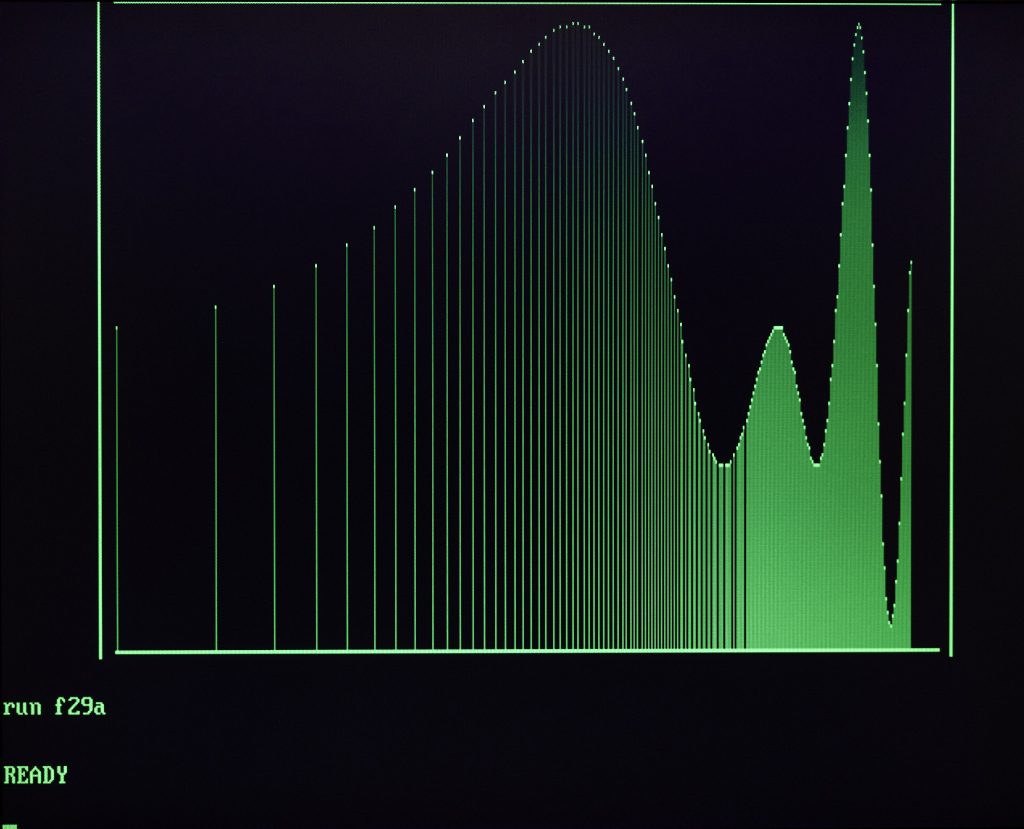
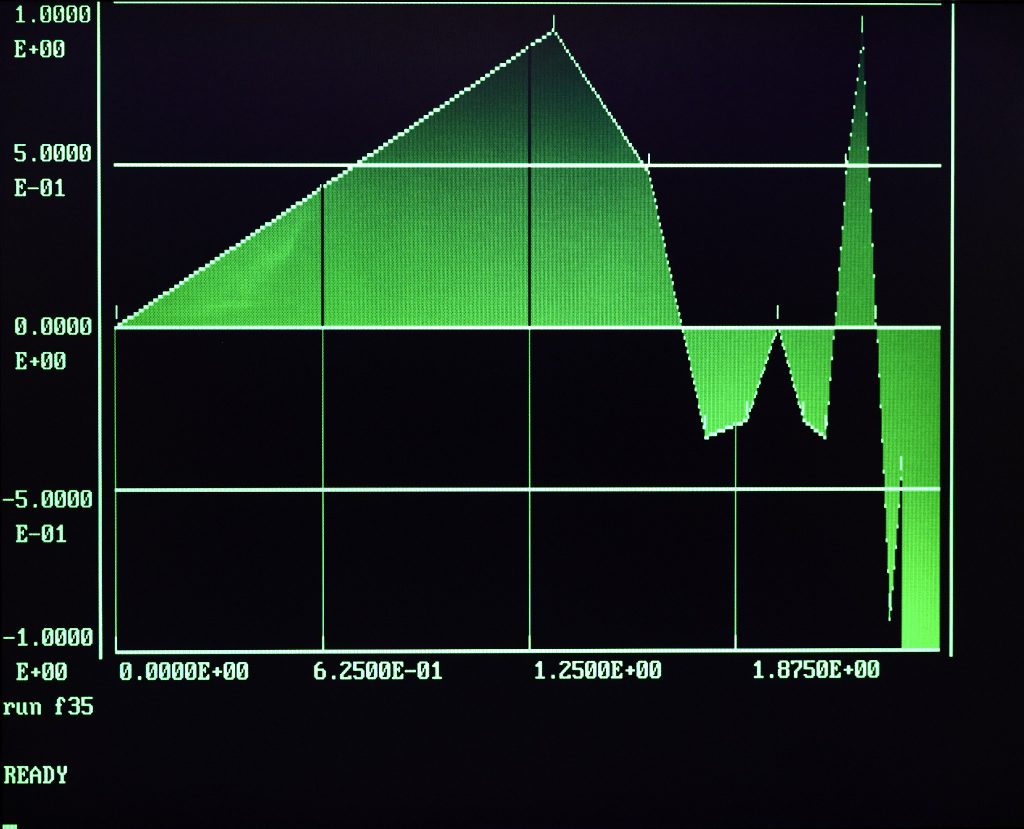
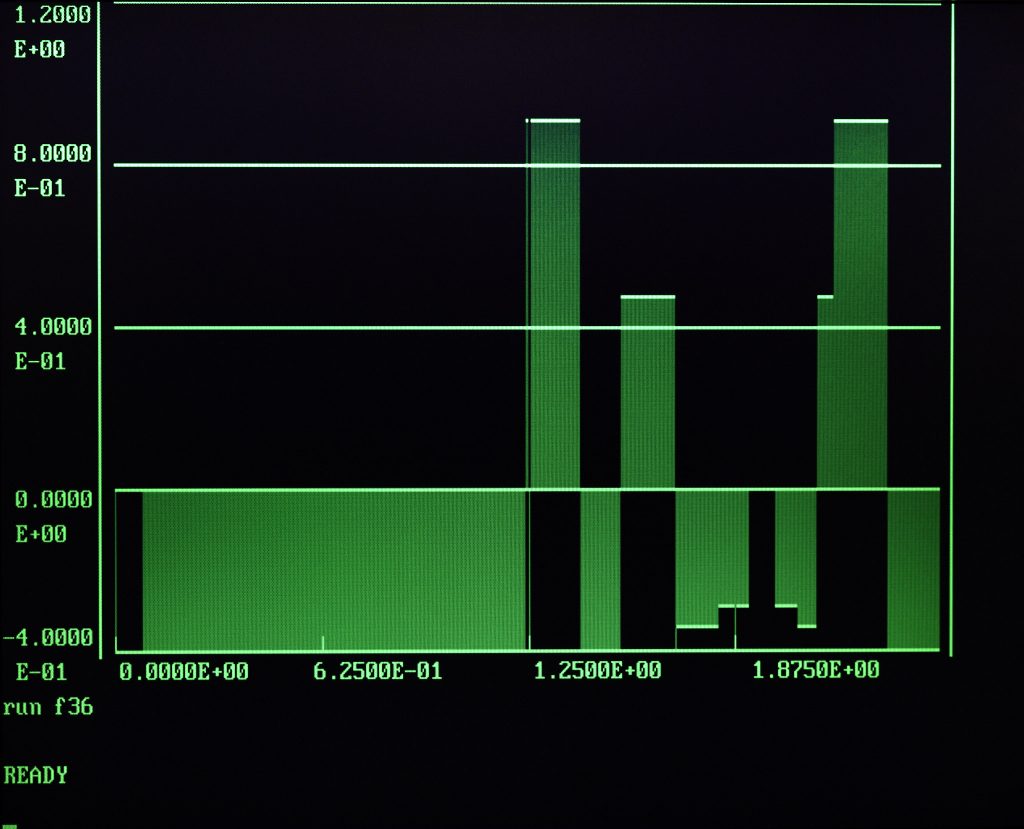
Chapter 4 in the book uses a single data set to showcase what else MINC can do with the vt105 graphics.
10 DIM X(255),Y(255)
20 FOR I=0 TO 255
30 X(I)=LOG10(I+1)
40 Y(I)=SIN(I*PI/50)*COS(I*PI/200)
50 NEXT I
I won’t go over all the examples – that would take out all the fun of trying yourself. Just a few examples of nice graphs…
So what I haven’t covered yet is that MINC can also do dynamic displays – moving graphs, or ‘strip charts’ in the official documentation. A bit like the electronic version of Hollywood’s interpretation of a seismograph, or a lie detector – one of those things with a roll of paper and a moving pen.
And of course you can put that together with the analog capabilities of the MINC – sample a real time signal and display the wave form on the terminal. Not quite the same thing as an oscilloscope, but signals in the single-digit Hz range come out nicely. And there’s a lot of options in signal capture that I haven’t had the time to play with yet 🙂
Meantime I’m finishing up the vt105 stuff – expect it on the download page soon! and there’ll be a bugfix for the MNCKW too!